If you've ever stared at a Google Analytics dashboard wondering what all those page views and "likes" actually mean for the business, you're not alone. The real work of analyzing content performance isn't just about tracking clicks; it's about connecting what you create to what the business needs to achieve.
It's a cycle: you define what success looks like, you track the right things, and then you use that information to make smarter decisions next time.
Why Most Content Analysis Fails and How to Fix It
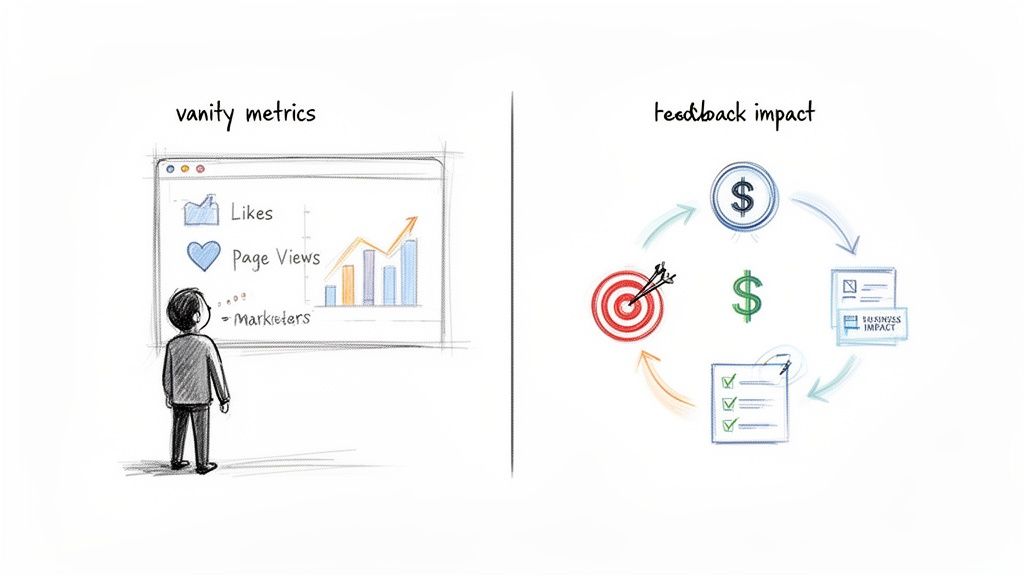
Let's be honest. Most content analysis falls flat because it gets hung up on vanity metrics. Likes, shares, and page views look great in a report, but they rarely tell you if the content actually did its job. This is the biggest reason teams feel like they're just guessing at what works.
This isn't just a hunch; it's a huge industry-wide problem. Marketers are pouring money into content, yet there's a serious confidence gap when it comes to measurement. In fact, a recent report found that only 51% of B2B marketers feel their organization measures content performance well, despite budgets continuing to climb. This disconnect puts a lot of pressure on us to get our analytics right. You can dig into more numbers in these latest content marketing statistics.
Shift Your Mindset From Metrics to a Feedback Loop
Truly effective analysis isn't about hoarding data—it's about creating a strategic feedback loop. Think of every blog post, video, or webinar as a question you're asking your audience. The performance data is their answer, and that answer should directly inform what you do next.
This is what connects your creative work to real business objectives.
For instance, don't just count the number of views on a webinar recording. Dig deeper and ask better questions:
Which topics sparked the most engagement or follow-up questions in the chat?
What specific pain points did people bring up during the live Q&A?
Are there certain segments of the video that are being replayed or shared the most?
The goal is to stop reporting on the past and start building a predictable map for the future. True content analysis tells you not just what happened, but what to do next.
Turn Raw Content Into Actionable Insights
Here's the tricky part. So much of our most valuable feedback is trapped in unstructured media—think of a one-hour project kickoff call, a customer interview, or raw video footage. There's gold in there, but it's inaccessible without the right approach.
This guide will give you a practical framework to build that measurement system. To bridge the gap, many teams are turning to tools like Notize AI, which can automatically transcribe, analyze, and summarize audio and video content. For video enthusiasts, this means you can send a long YouTube lecture to Notize AI and get key takeaways in seconds. For professionals, that messy meeting recording becomes a searchable, analyzable asset with action items and key decisions highlighted.
This is how you turn unstructured media into a strategic advantage, making it easier than ever to understand what truly connects with your audience and make decisions backed by real data.
Setting Goals That Connect Content to Business Impact
Before you even think about tracking a click or a page view, you have to ask yourself a simple question: what does success actually look like for us? Without a clear destination, you’re just driving blind. Any serious content performance analysis starts by setting measurable goals that directly support the bigger business picture.
Whether you're trying to generate high-quality leads, shift how people perceive your brand, or build a loyal customer base, every goal needs a clear, straight line connecting it back to the company's bottom line. This means you have to move past generic metrics and pick the key performance indicators (KPIs) that really tell you something about business impact.
From Business Metrics to Content KPIs
The most effective way I've found to do this is to work backward from a high-level business metric. Think about the numbers your CFO cares about, like Customer Acquisition Cost (CAC) or Customer Lifetime Value (CLV). Your content should absolutely be influencing these numbers, even if it’s a few steps removed.
From there, you can drill down into more specific Content Performance Indicators (CPIs). For instance, a SaaS company focused on lowering its CAC won't just track the number of webinar attendees. That's a vanity metric. Instead, they'll zero in on the conversion rate from webinar attendee to qualified demo request. The goal isn’t just viewership; it’s finding high-quality leads.
On the other hand, a creator building an audience might prioritize audience retention and watch time for their YouTube series. Why? Because that directly grows their subscriber base, which is their primary business asset.
A goal without a number is just a wish. The key is to attach a specific, measurable KPI to every piece of content you create. This simple step transforms your content from a creative exercise into a strategic business function.
This initial goal-setting phase is often where things fall apart. You have a great kickoff meeting, everyone is excited and aligned, but if those key decisions and action items aren't captured and documented, that alignment evaporates within a week.
This is exactly where a tool like Notize AI can make a huge difference. By recording those strategic meetings, Notize AI automatically produces a full meeting summary, key discussion points, and a clear list of action items with speaker-attributed segments. This keeps everyone—from writers to marketers to sales—on the same page and working toward the same goals from day one.
Choosing the Right Metrics to Track
With your goals clearly defined, it's time to pick the right metrics. As content libraries grow, the industry is thankfully moving away from pure reach and focusing more on metrics that signal genuine interest and intent. A recent benchmark analysis shows that the core metrics every team should be tracking are engagement rate, conversion rate, time on page, bounce rate, and page views per session.
When you focus on the right things, the results can be dramatic. I saw one SaaS brand refresh a key content asset and watch its conversion rate climb to 2.4% (a 33% uplift). That led to a 142% jump in leads and a calculated ROI of 2,350% in just 30 days. You can dig into more details in this content performance metrics report.
Here’s a practical way to map your business goals to specific content KPIs.
Mapping Business Goals to Content KPIs
This table helps you connect overarching business objectives to specific, trackable content metrics, ensuring your analysis is always tied to what matters most.
Business Goal | Primary Content KPIs | Example Content Format | How Notize AI Helps |
|---|---|---|---|
Increase Brand Awareness | Branded search volume, social media reach, backlinks | Top-of-funnel blog posts, infographics | Analyze interviews with industry experts to generate customizable blog posts, pulling shareable quotes and insights. |
Generate Marketing Qualified Leads | Form submission rates, lead quality scores, content downloads | Webinars, eBooks, case studies | Turn a live webinar into a downloadable summary and a step-by-step guide, automatically identifying action items. |
Improve Customer Loyalty | Repeat visitor rate, newsletter sign-ups, community engagement | How-to guides, customer success stories | Capture customer feedback calls to identify common questions and create helpful tutorial content. |
Drive Sales Enablement | Content influence on deals, pipeline velocity | Product demos, competitive comparison guides | Record sales meetings and training sessions; get searchable notes and a timeline of important moments for quick review. |
When you align your content strategy this way, your analysis becomes a powerful tool for proving its value. You’re no longer just reporting on metrics; you’re telling a clear story about how your content is driving tangible business growth. This structured approach is the foundation for mastering how to analyze content performance effectively.
Creating a Single Source of Truth for Your Data
If you want to analyze content performance well, you need good, centralized data. But let's be real—for most of us, the numbers are scattered everywhere. Your traffic data is in Google Analytics, leads are tracked in your CRM, and every social media channel has its own little dashboard. It's a mess.
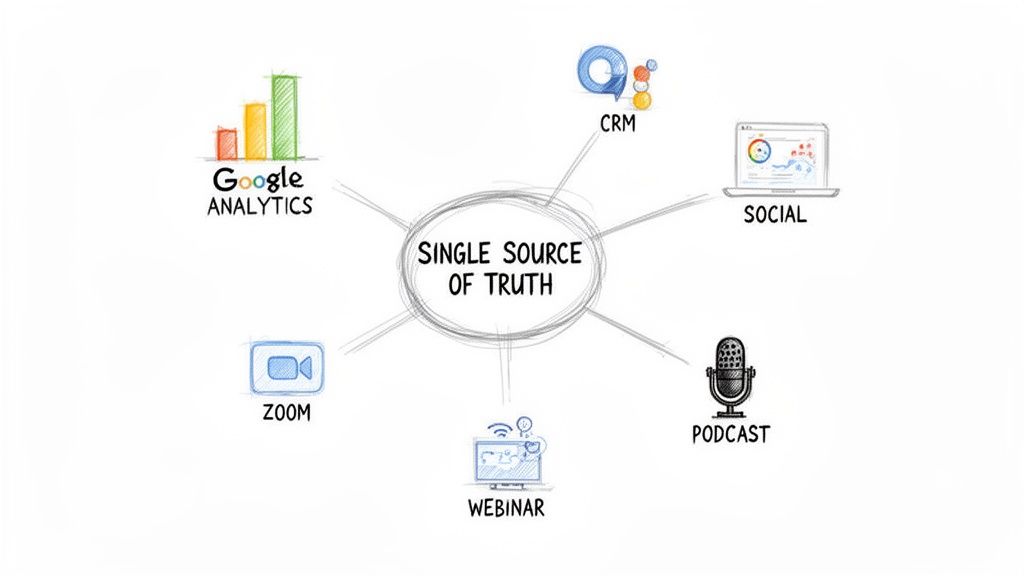
Before you can pull out any real insights, you have to get all that information into one place. Creating a "single source of truth" doesn’t mean you have to buy some massive, expensive platform. It just means having a repeatable process for pulling together the data that actually matters.
The first move is to map out your core data sources. For most content teams, that list looks something like this:
Website Analytics: Tools like Google Analytics are your bread and butter for page views, average engagement time, and user behavior.
CRM Data: This is where you connect content to actual business results—think leads, conversions, and revenue.
Social Media Platforms: Each network has its own native analytics that give you the scoop on reach, likes, comments, and shares.
Unifying Your Unstructured Media
Here's the thing: pulling numbers from dashboards is the easy part. The real challenge is wrangling all the incredibly valuable but unstructured media that most analytics tools completely ignore. I'm talking about the gold hidden inside a Zoom webinar, a podcast interview, or a recorded customer call.
This is where a tool like Notize AI becomes your central hub. By simply uploading these media files—or even links from YouTube, TikTok, and Instagram—you can turn a jumble of conversations into a structured, searchable content library. Notize AI handles the heavy lifting by transcribing, summarizing, and making every word findable.
Think about a journalist who just finished an hour-long interview. Instead of manually re-listening and scrubbing through audio, they can use Notize AI to instantly pull powerful quotes, spot key themes, and even generate a customizable blog post based on the conversation, ready to be published on their own blog within the app.
The goal is to build a unified view where both your quantitative dashboards and qualitative media insights live together. This holistic perspective is the foundation for truly understanding how to analyze content performance.
From Disconnected Files to an Organized System
Once you start centralizing your media in a platform like Notize AI, you can connect the dots in ways you couldn't before. You can finally track which topics from a brainstorming session actually perform well when turned into a blog post. A student could upload all their lecture recordings, PowerPoints, and even PDFs to Notize AI to create instant, organized study guides and chat with the AI to get simplified explanations of difficult concepts.
What you're really doing is building a dedicated knowledge management system for your content. If you want to dive deeper, we have a whole guide on what is a knowledge management system and why it's a game-changer.
The benefits are pretty immediate. Notize AI lets you organize all your files into neat folders. A marketing team, for instance, could create a shared folder for all their Q3 planning meetings. Now everyone has access to the same summaries and action items, which keeps the entire team on the same page.
Connecting Qualitative Insights to Quantitative Metrics
With your unstructured media finally organized, the last step is to tie it all back to your performance metrics. This is how you close the loop and get the complete picture.
Here’s what that looks like in the real world:
Capture the Media: You host a webinar and hit record. Afterward, you upload the video file straight into Notize AI.
Analyze and Structure: Notize AI automatically generates a full transcript, a concise summary, and a list of key discussion points. You notice a 10-minute segment on a new feature sparked a ton of audience questions.
Repurpose and Publish: Bingo. You create a short blog post and a couple of social media clips focused specifically on that high-engagement segment.
Track the Performance: Now you watch the numbers roll in. You monitor page views and engagement on the blog post in Google Analytics and track the shares and comments on the social clips.
Connect the Dots: You can now confidently say that the new content’s success was directly driven by an insight you pulled from the original webinar.
This simple workflow transforms your content analysis from something you do after the fact into a proactive, strategic part of your process. You’re no longer just looking at numbers; you’re understanding the why behind them.
Finding the Story Behind Your Numbers
Analytics dashboards are great at telling you what is happening with your content. You can see how many people visited, how long they stayed, and where they clicked from. But the numbers alone can't tell you the most important part: why people are behaving that way.
To really get to the bottom of your content's performance, you have to dig into the human side of the data. This means looking past the charts and graphs to understand what people are actually saying in the comments, what they're trying to find with their search queries, and what common themes pop up in customer feedback. This qualitative analysis is what turns raw data into a real strategic advantage.
From Raw Feedback to Real Insights
Let's be honest—qualitative feedback is usually a mess. It's buried in hours of call recordings, sprawling comment threads, and unstructured conversations. No busy team has the time to manually sift through all of it.
This is where technology can do the heavy lifting for you. With a tool like Notize AI, you can upload hours of customer support calls and have it instantly pinpoint the most common pain points. A creator could feed it a long interview and use the AI chat to pull out powerful quotes or find recurring questions without having to scrub through the audio for hours.
For professionals: Imagine turning a two-hour customer feedback session into a tight summary that highlights the top three feature requests. With Notize AI, this is something you can do in minutes.
For creators: A blogger can use Notize AI to analyze an interview, get suggestions for stronger hooks, and generate a draft for a blog post, all from the original audio file.
For students: You could upload a lecture recording to Notize AI and just ask it to explain a complex concept, and it will jump you to the exact moment it was discussed.
This approach transforms qualitative analysis from a frustrating chore into one of your biggest strategic assets.
The most powerful insights are often hidden in plain sight, trapped within your raw, unstructured media. Unlocking them is the key to creating content that truly resonates.
Interpreting the Signals
Once you have a system for processing all this information, you can start hunting for patterns. The real goal here is to connect these qualitative signals back to your hard numbers. You can learn more about making this connection by reading our guide on how to measure content performance.
For instance, you might see in Google Analytics that a particular blog post has a crazy-high time-on-page. That's the what. The why might be buried in the comments section, where you find a dozen users asking detailed follow-up questions. That's a clear signal of deep engagement.
Performance data consistently shows that the depth and structure of your content have a massive impact on outcomes like time-on-page. In fact, readers spend about 3.5× more time on in-depth editorial content, and 57% of marketers say long-form is their best-performing content type. At the same time, AI is changing the game, with 68% of companies reporting higher content marketing ROI after adopting it. This just shows how valuable it is to turn raw media into deep, structured assets you can actually analyze. You can find more stats like these in this report on long-form content statistics.
When you combine the quantitative with the qualitative, you finally get the complete picture. You don't just know which content is performing well; you understand the specific ingredients that are making it successful, giving you a repeatable recipe for future wins.
Building Reports That Actually Drive Action
After all the tracking, segmenting, and number-crunching, we've arrived at the most important part: turning all that data into a story that gets people to act. Raw numbers are just noise; they're useless unless they lead to smarter decisions. Your job now is to build a clear, compelling report that shows your team not just what happened, but what we should do next.
A great report is more than just a data dump—it’s a narrative. It needs to be visual, to the point, and built for the specific people reading it. The real goal here is to move past simply "reporting the metrics" and start a real conversation about making our content better.
Visualizing Your Content's Journey
It's a well-known fact that our brains process images 60,000 times faster than text. This is exactly why data visualization is your secret weapon in reporting. Instead of burying your team in spreadsheets, use simple charts and graphs to make your main points impossible to ignore.
Good visuals turn dense data into insights you can grasp in seconds.
Trend Lines: Want to show how engagement for a content pillar has grown over the last quarter? A simple line chart does the trick, conveying momentum in a way a list of numbers never could.
Bar Charts: These are perfect for comparing different content types head-to-head. You can see at a glance if your webinars are bringing in more qualified leads than your blog posts.
Heatmaps: If you want to understand how people really use a page, a heatmap is invaluable. It shows you exactly where they’re clicking and where their attention drops off.
The trick is to match the visual to the story you're trying to tell. Always keep your charts clean, simple, and focused on a single, powerful takeaway.
Speaking the Right Language to the Right People
One of the most common mistakes I see is creating a one-size-fits-all report. Your leadership team and your content creators care about completely different things. If you want to get buy-in and actually inspire action, you have to tailor your story to each audience.
The C-suite is thinking about the big picture and the bottom line.
For Leadership: Keep the focus on ROI, pipeline influence, and how content is driving down the Customer Acquisition Cost (CAC). You need to connect the dots between your content work and the company's revenue goals.
Your content team, however, needs tactical direction. They need to know what to do on Monday morning.
For the Content Team: This is where you zoom in. Highlight the topics that are hitting home, the headlines getting all the clicks, and the questions that pop up again and again in audience feedback. Give them the raw material they need to make their next piece of content a hit.
This is where a tool like Notize AI can be a game-changer. Let’s say you just finished a round of customer feedback calls. Instead of asking a product manager to scrub through hours of recordings, Notize AI can instantly pull a shareable summary with key themes, action items, and memorable quotes. It’s a brilliant way to translate those rich customer insights directly into clear next steps for everyone, making reporting faster and genuinely more useful.
A Simple Template for Actionable Reports
To make this whole process a bit less painful, it helps to have a simple reporting template. When you structure your reports consistently, you train your stakeholders to know exactly where to find the information they need every time. A solid report should always tell a story: where we were, where we are now, and where we’re headed next.
Here’s a basic structure that I've found works really well for monthly or quarterly updates.
Content Performance Reporting Template
This is a straightforward template outlining the key pieces of a monthly or quarterly content performance report, designed to be adapted for different audiences.
Report Section | What It Includes | Key Metric to Highlight | Audience (e.g., Leadership, Content Team) |
|---|---|---|---|
Executive Summary | A one-paragraph overview of the key findings, wins, and recommendations. | Overall Content ROI or Lead Generation Growth | Leadership |
Performance vs. Goals | A clear visual showing how you tracked against the KPIs set for the period. | Conversion Rate from content assets | Leadership & Content Team |
Top Performing Content | A list of the top 5-10 pieces of content, explaining why they performed well. | Engagement Rate and Time on Page | Content Team |
Audience Insights | Key themes from comments, feedback calls, or webinar Q&As. | Direct quotes or common questions | Content Team |
Key Learnings & Next Steps | A bulleted list of actionable recommendations based on the data. | A clear plan for the next 30-60 days | Leadership & Content Team |
By adopting a structured approach like this, your reports will transform from a backward-looking chore into a forward-looking tool that actively guides your entire content strategy.
Turning Your Insights Into a Content Goldmine
All this analysis is just an interesting academic exercise if you don't do anything with it. This final step is all about closing the loop—transforming what you've learned into a predictable, data-driven content engine. The goal is to stop just measuring what happened and start systematically scaling what works.
This is where the real payoff is. You're not just building reports; you're creating a repeatable process for getting better results, month after month.
The flow is simple but incredibly powerful. You analyze the data, report on the findings, and then, most importantly, you act.
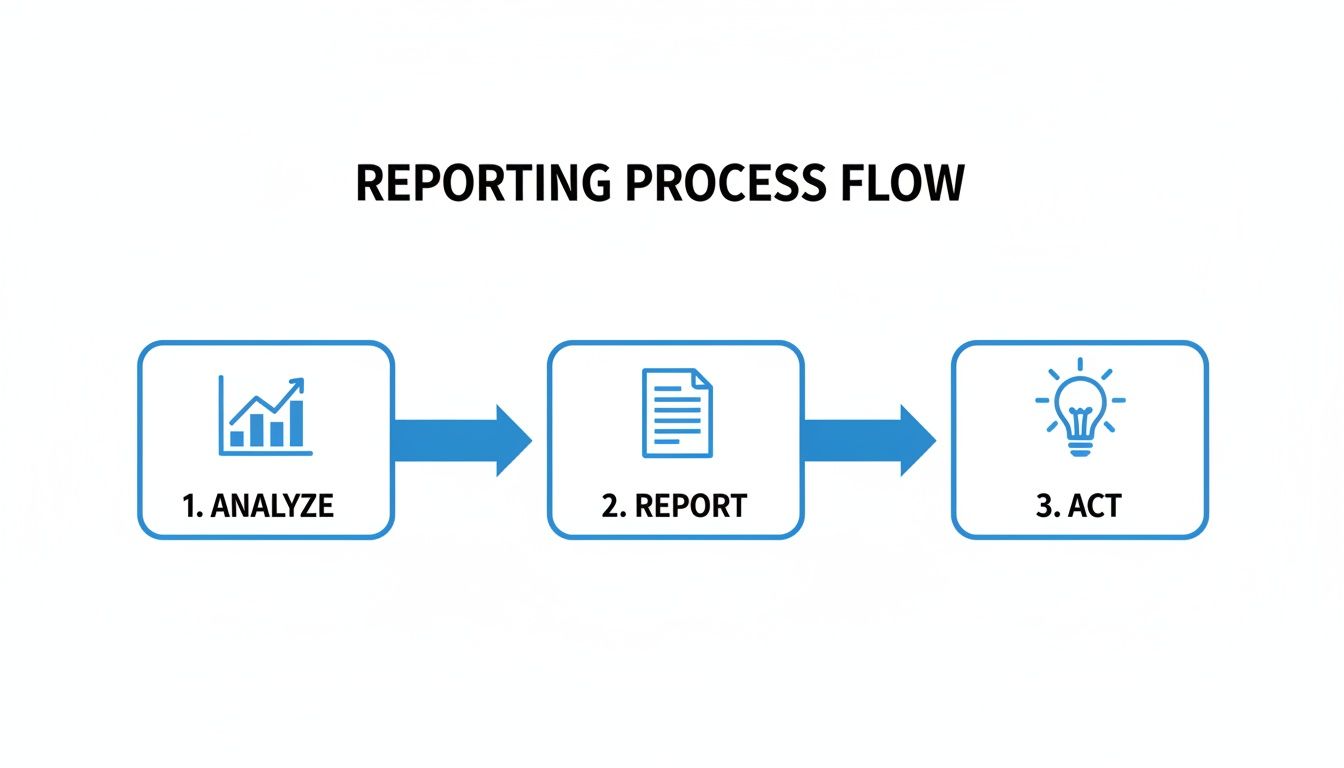
This simple framework ensures your hard-won insights don't just sit in a folder somewhere. They become the fuel for tangible improvements.
Creating a Continuous Optimization Cycle
Think of your insights report as a roadmap for what to do next. The best way I've found to organize this is to prioritize actions based on their potential impact versus the effort they'll take.
I like to start by bucketing existing content into three main categories:
High-Potential Assets: These are your evergreen pieces that already do pretty well but have the potential for so much more. Maybe it's a blog post that ranks on page two or a video with solid watch time. Refreshing it with new data, adding more depth, or tightening up the on-page SEO can often give it the push it needs.
Underperforming Content: These are the articles and videos that had a great premise but just... flopped. Before you hit delete, figure out why. Was the topic a miss, or was the execution just a bit weak? I've seen simple rewrites or a new angle completely resurrect a piece that was otherwise dead in the water.
Proven Winners: This is your top 1-5% of content—the home runs. Don't just update these. Think about how you can multiply their impact.
The most effective content strategies don't just focus on creating the next new thing. They systematically squeeze more value out of what they already have.
Acting as a Content Multiplier
This is where you can get really strategic. Take that one-hour webinar that absolutely killed it last quarter. Instead of letting it gather digital dust, you can use a tool like Notize AI to instantly turn it into a dozen different assets.
With a single upload of that webinar recording, Notize AI could help you generate:
A concise, shareable summary for your next email newsletter.
A detailed, step-by-step guide for the company blog.
A series of pull-quote graphics and short video clips for LinkedIn and Twitter.
A full, polished article ready to be published as a thought leadership piece.
Suddenly, that one successful webinar becomes an entire campaign's worth of material. This isn't just a time-saver; it’s a core tenet of effective content repurposing strategies that can dramatically boost your content ROI.
For a marketing team, this means a single customer interview can fuel case studies, social proof, and internal sales training. For a creator, one long-form video can be atomized into a week's worth of engaging shorts, keeping their audience hooked across multiple platforms without the burnout.
By closing the loop and taking decisive action, you shift from guessing what might work to building a predictable, high-impact content machine.
A Few Common Questions
Let's tackle some of the questions that often come up when people start digging into their content performance. These are the details that can make or break your strategy.
How Often Should I Really Be Doing This?
The honest answer? It depends. There's no magic number here. For something fast-paced like your social media feed, you’ll want to glance at the numbers at least weekly to see what's popping and what's flopping.
But for your big, evergreen blog posts that rely on SEO, a monthly check-in is much more realistic. It takes time for that kind of content to find its audience and for the data to tell a real story. Then, for the big-picture view, make sure you're doing a deeper strategic dive every quarter. This is when you step back and ask if your content is still lining up with the company's main goals. The key isn't the exact schedule, but sticking to it consistently.
What’s the Real Difference Between “Performance” and “Effectiveness”?
This is a fantastic question, and getting it right is crucial.
Content performance is all about the hard numbers—the what. We're talking about your page views, how long people stick around, and your click-through rates. They're the raw metrics.
Content effectiveness, however, is about the so what. It’s the measure of whether your content actually moved the needle on a real business goal. Did that article bring in qualified leads? Did that video series help with customer retention? High performance doesn't automatically mean it was effective.
Think of it this way: a video that racks up a million views (great performance) but generates zero sales leads (poor effectiveness) is ultimately a failed investment. Your analysis needs to connect both dots to truly understand your content's ROI.
Is It Possible to Analyze Offline Content Like a Webinar?
Absolutely, and this is where things get really interesting with modern tools. You don't have to let the insights from a live event disappear once it's over.
Just record the audio or video from your webinar and drop it into a platform like Notize AI. It can actually go through the entire conversation and pull out the main themes, find the questions your audience asked most, and even pinpoint moments that got the most engagement.
This lets you measure the impact of everything you create from that webinar—new blog posts, short video clips, downloadable guides, you name it. You've just turned a one-time event into a content goldmine that keeps providing measurable value long after you've logged off.
Ready to stop guessing and start building a content engine fueled by real data? With Notize AI, every conversation, video, and audio file becomes a source of clear, actionable insights. Start centralizing and analyzing your content today.
How to Analyze Content Performance: Turn Data into ROI