Measuring content performance is all about connecting the dots. It’s about proving that every article, video, and social post you create actually moves the needle for the business. We have to look past the easy, surface-level numbers and tie our work directly to things that matter—like revenue, brand lift, and customer loyalty.
That's how you show the true value of content.
Beyond Views and Likes: What Truly Defines Content Performance
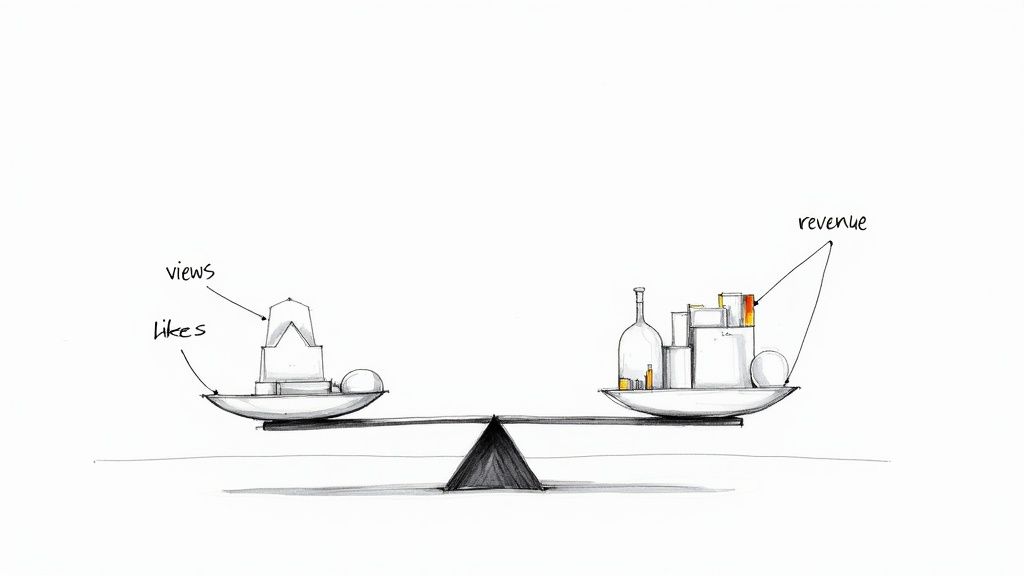
It’s a classic mistake I see all the time: content teams dive into measurement without a real strategy. They get mesmerized by vanity metrics like page views, social media likes, and follower counts. Sure, those numbers feel good to report, but they rarely answer the one question that really matters: Is our content actually working?
To get this right, you have to fundamentally shift how you define success. Stop asking how many people saw your content and start asking what they did because of it. Did that blog post lead to a newsletter signup? Did that webinar generate a qualified lead? Did that case study help close a deal? This is the crucial leap from measuring visibility to measuring real-world impact.
Moving from Vanity Metrics to Value Metrics
The bedrock of any solid measurement plan is tying your content goals directly to the company's business objectives. Without that connection, you’re just collecting data in a vacuum. It’s all noise and no signal. Imagine using a tool like Notize AI to instantly capture and summarize your team's strategy meetings. You'd have a full, structured summary, action items, and a searchable record of your goals, making sure everyone is on the same page about what success looks like right from the get-go.
This alignment is what allows you to graduate from vanity metrics to value metrics.
Instead of just tracking blog views, focus on how many marketing-qualified leads (MQLs) a post generates.
Instead of counting video likes, track the click-through rate on the call-to-action you placed at the end.
Instead of obsessing over follower growth, analyze the conversion rate of the traffic coming from your social channels.
This simple flow chart really drives the point home—setting clear goals is the non-negotiable first step. Without it, you can't measure performance, and you certainly can't prove your value to the business.
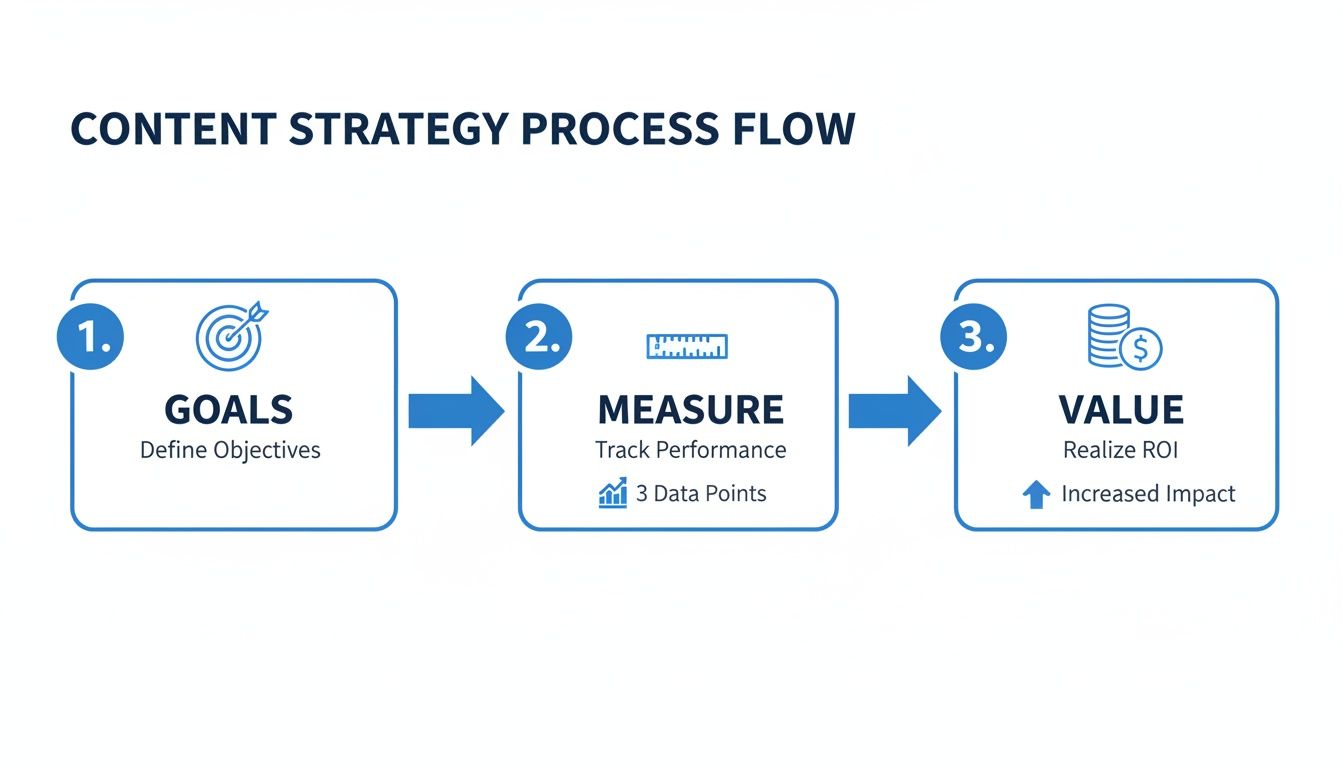
As the visual shows, if you skip the goal-setting, you're just tracking numbers for the sake of it, not tracking actual outcomes.
The Four Pillars of Content Performance
To build a comprehensive picture, it's helpful to think about measurement in four key areas. These pillars connect your content's initial reach to its ultimate business impact, giving you a framework for telling a complete performance story.
Pillar | What It Measures | Example KPI |
|---|---|---|
Reach & Awareness | How many people are seeing your content? | Unique Visitors, Social Impressions, Keyword Rankings |
Engagement | Are people interacting with your content? | Time on Page, Bounce Rate, Comments, Shares, CTR |
Conversion | Is your content driving desired actions? | Lead Generation, Demo Requests, Newsletter Signups |
Business Impact | Is your content contributing to revenue and growth? | MQLs, SQLs, Content-Sourced Revenue, Customer LTV |
By tracking metrics across all four pillars, you can see not just if your content is working, but how and where it’s making a difference.
The Challenge of Gaining True Clarity
Even with the best intentions, getting a crystal-clear view of performance is a huge challenge. The data backs this up. One study I came across showed that while 61% of marketing leaders felt they had "at least somewhat clear insights," a mere 26% claimed "full clarity" on their content's performance. You can dig into more of those content performance statistics yourself. It's a widespread problem that points to a serious need for better reporting and shared benchmarks.
The real goal isn't just to collect data—it's to collect the right data that tells a compelling story about your content's contribution to the bottom line. True performance is measured in outcomes, not just outputs.
This is where having a unified system becomes so important. Your tools, your team, and your strategy all need to be in sync. For instance, a creator could use a platform like Notize AI to automatically generate a blog post from an interview video. The platform’s own analytics could then track that post’s performance, directly linking the act of creation to audience engagement metrics. That kind of integration provides a clear line of sight from effort to impact, finally closing the loop between creating content and truly understanding its value.
Aligning Content Goals with Business Objectives
Let's be honest: measuring content performance is a waste of time if you don't know what "good" looks like. If your content doesn't have a clear purpose tied directly to a real business objective, you're just creating noise. Your metrics will be a random collection of data points that don't tell you anything about the impact you're actually making.
The first step is to get specific. A goal like "increase brand awareness" is far too vague. Instead, aim for something you can actually measure, like "increase branded search volume by 15% this quarter." That simple shift turns a fuzzy idea into a concrete target you can build a real strategy around.
These goals often emerge from lively brainstorming sessions, but those meetings can easily get chaotic, with great ideas getting lost in the shuffle. This is where a tool like Notize AI can be a game-changer. Imagine recording your team's strategy session and getting an automated, structured summary moments after it ends. You'll have key discussion points, highlighted decisions, and action items all laid out, creating a single source of truth so everyone knows exactly which goals and KPIs they're responsible for.
From Business Goals to Content KPIs
Once you’ve locked in your high-level business objectives, the real work begins: translating them into specific Key Performance Indicators (KPIs) for your content. This is how you build the bridge between what you create and the results the business cares about. Think of it as a pyramid, with each level supporting the one above it.
Different goals naturally call for different KPIs. Here’s how this looks in practice:
Goal: Generate Qualified Leads
Your KPIs: Forget vanity metrics. Focus on MQLs (Marketing Qualified Leads) per post, the conversion rate on your gated content, and the number of demo requests that came from a content page. These directly tie your content to the sales pipeline.
Goal: Improve Customer Retention
Your KPIs: Track engagement with post-purchase educational content, views on tutorial videos, and, importantly, a decrease in support tickets for topics you've covered in your help docs. This proves your content is making the product stickier.
Goal: Build Brand Authority and Awareness
Your KPIs: Keep an eye on organic keyword rankings, branded search volume, your share of voice on social media, and backlinks from reputable sites. These are all signs that you're becoming a go-to resource in your industry.
Think of it like a student using Notize AI to record their lectures. They don't just get a word-for-word transcript; they get smart summaries, can ask the AI questions about the material, and can instantly jump to the exact moment a topic was explained. In the same way, content teams need to move beyond just tracking page views and find the metrics that deliver genuine insight.
The most powerful content measurement frameworks don't just track what happened; they explain why it happened. Connecting a top-of-funnel blog post to a closed deal six months later tells a compelling story about your content's long-term value.
Distinguishing Leading from Lagging Indicators
A classic mistake I see teams make is treating all metrics as equals. To really understand your performance, you have to know the difference between leading and lagging indicators.
Leading indicators are your early warning system. They're the metrics that signal future success and tell you if your strategy is on the right track.
Examples: Organic traffic, improvements in keyword rankings, time on page, and social media engagement.
Lagging indicators, on the other hand, measure what’s already happened. They are the final outputs—the business results you were aiming for all along.
Examples: Revenue attributed to content, customer lifetime value (LTV), and total qualified leads generated.
Your job is to figure out which leading indicators reliably predict your desired lagging indicators. For instance, if you discover that blog posts with an average time on page over three minutes consistently generate more newsletter sign-ups (a lagging indicator), you’ve found gold. Now you can focus on creating more content that holds reader attention.
This is where you can get really smart. A content team could use Notize AI to analyze a batch of customer interview videos, automatically pulling out recurring pain points and questions. This qualitative data is the "why" behind your quantitative numbers, helping you create content that solves real problems and, in turn, boosts those crucial leading indicators. This deep alignment is what separates a good content measurement strategy from a great one.
Assembling Your Content Measurement Toolkit
Once you've got your goals and KPIs locked down, it's time to talk about tools. How are you actually going to get the data you need? This is where your tech stack comes in. Don't let the term intimidate you; it's just the set of tools that work together to give you the full story on your content's performance.
Think of it like building a home workshop. You don't need every gadget under the sun, but you absolutely need a good hammer, a reliable saw, and a tape measure. Getting these foundational pieces in place—and making sure they’re set up correctly—is the key to everything that follows.
The Core Components of Your Measurement Stack
Most content teams can get an incredibly powerful view of their performance with just a few key platforms. The goal here isn’t to drown in data; it’s to gather the right information efficiently.
Here’s what I consider the non-negotiables:
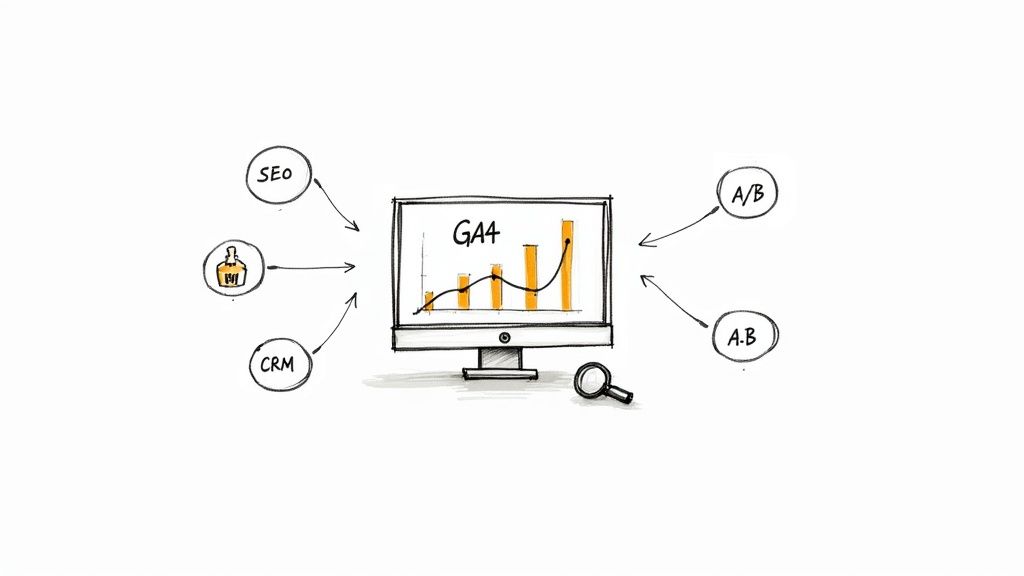
Web Analytics (e.g., Google Analytics 4): This is your home base for on-site behavior. It’s the tool that tells you who’s visiting, where they came from, what they’re reading, and whether they’re sticking around. This is where you'll live when tracking metrics like sessions, engaged users, and conversion events.
SEO Tools (e.g., Ahrefs, Semrush): You need a way to see how your content is performing out in the wild world of search engines. These platforms are essential for tracking keyword rankings, finding backlink opportunities, and keeping an eye on what your competitors are doing. They give you the data you need to actually win in organic search.
Customer Relationship Management (CRM) (e.g., HubSpot, Salesforce): This is the magic ingredient that connects your content to real business results. When your website and CRM are properly connected, you can finally see which blog posts are generating qualified leads and, ultimately, driving revenue.
Here's a peek at what an SEO tool's dashboard looks like. It’s a great example of how you can visualize the connection between your content efforts and your search engine visibility.
This kind of view is priceless because it helps you spot trends and prove that the content you’re creating is actually moving the needle on a critical leading indicator: organic traffic.
Go Beyond the Numbers: Adding Qualitative Insights
The numbers tell you what is happening. A high bounce rate, a low conversion rate—that's the "what." But they almost never tell you why. That's where qualitative data comes in, and frankly, it's a game-changer.
You can add a whole new layer of understanding to your toolkit by finding ways to capture the voice of your customer.
This is an area where a platform like Notize AI can be incredibly helpful. Let's say you have a folder full of recorded customer interviews or sales calls. You can simply upload them, and the platform will automatically pull out key pain points, direct quotes, and common themes. Suddenly, you have deep, actionable insights into what your audience is really thinking and struggling with.
By combining the "what" from your analytics with the "why" from qualitative sources, you get a much richer, more accurate understanding of why certain content connects and converts.
For instance, your analytics might show a blog post about a specific product feature is underperforming. But after running a few customer feedback calls through Notize AI, you might discover that people are fundamentally confused about that feature's main purpose. Armed with that "why," you can rewrite the content to address their actual questions, which will almost certainly improve its performance.
Setting Up Your Tools for Success
Just having the tools isn't enough; they have to be configured properly. This is a step people often rush, but it's crucial for data accuracy. This means taking the time to set up event tracking in GA4 for your key conversions, making sure your CRM integration is properly attributing leads to the right content, and periodically checking for any weird data inconsistencies.
As you start gathering data, keep in mind that how we define "engagement" has shifted. The industry is moving away from vanity metrics like simple pageviews. Instead, focus on signals that show real interest, like engaged sessions, time-on-page, scroll depth, and micro-conversions. These metrics give you a much better sense of content quality. If you want to dive deeper, you can find more information about the top content marketing KPIs.
For teams that want to make this process even smoother, you can use Notize AI to document your setup. Imagine recording a quick screen-share video walking through your Google Analytics configuration. Notize AI can create an instant transcript, a step-by-step guide, and a summary, giving you a perfect training document for new team members. To see how that works, check out our guide on automated transcription services.
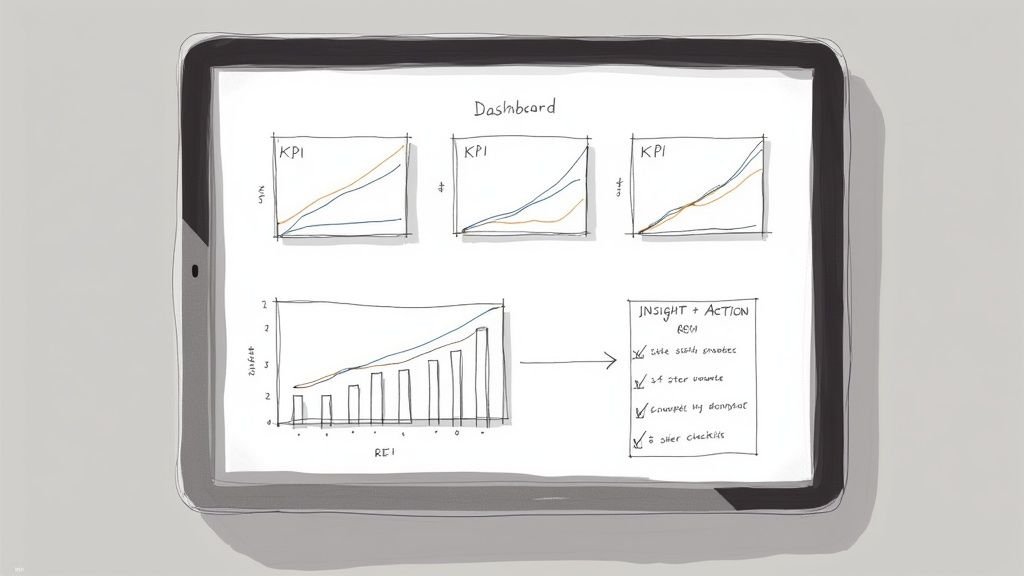
Building Dashboards That Actually Get Used
Let's be honest: raw data is overwhelming. A spreadsheet full of numbers isn't going to convince anyone of your content's value. The real magic happens when you turn that data into a clear, compelling story that drives decisions. A great dashboard doesn't just show you metrics; it visualizes your progress, flags opportunities, and makes complex information dead simple to understand for everyone, from your writers to the CEO.
Think of your tools—whether it's Google Looker Studio, HubSpot, or another analytics platform—as your canvas. Your job is to paint a picture that answers the most important questions at a glance. Are we hitting our lead targets? Is our brand content actually reaching the right people? A well-designed dashboard gives you these answers without forcing you to dig through endless rows of data.
This visual storytelling is what separates a report that gets filed away and forgotten from one that truly inspires action.
One Size Fits Nobody: Tailor Your Reports
A single, massive dashboard for the whole company is a recipe for disaster. Different people care about different things, and your reporting needs to reflect that. Showing your CEO the same nitty-gritty details you give your content creators will just make their eyes glaze over. The trick is to give each audience exactly what they need—no more, no less.
For the Executive Team: They need the 30,000-foot view. Stick to high-level, bottom-line metrics. Think content-influenced revenue, MQLs generated, and overall ROI. A simple, clean visual is far more powerful than a detailed breakdown of blog post views.
For Marketing Leadership: They're the bridge between strategy and execution. Their dashboard should show how content is performing against the department's goals. Include metrics like lead-to-customer conversion rates, channel performance (organic vs. social, for instance), and progress on key strategic content pillars.
For the Content Team: Your creators need the in-the-weeds data to do their jobs better. Give them actionable, leading indicators like time on page, scroll depth, top-performing keywords, and click-through rates. This is the feedback that helps them understand what’s working so they can double down on it.
A dashboard’s success isn’t measured by how much data you can cram into it, but by the quality of the conversations it starts. The right chart, shown to the right person, can completely change the direction of your content strategy.
Ditch the Manual Drudgery with Smart Automation
Putting together these dashboards is one thing. Keeping them updated and communicating the insights without burning out is the real challenge. Nobody loves the repetitive grind of pulling data, pasting it into slides, and writing up summaries. This is where a little automation goes a long way.
One of the best ways I've found to break this cycle is to record a quick video walkthrough of your dashboard each week or month. Instead of a static report, you can personally walk your team through the key trends in just a few minutes, pointing out big wins and flagging areas that need attention. It’s more personal and often much clearer than an email.
To make this even easier, you can use a tool like Notize AI. After recording your screen, just upload the video. Notize AI will automatically generate a structured summary with key takeaways, highlights, and clear action items. This transforms a simple video into a professional, shareable report. For content creators, Notize AI can even help turn that internal analysis into a blog post, getting double the value from your reporting efforts by repurposing internal content for an external audience.
This kind of workflow makes sure crucial findings are shared consistently across the company. It builds accountability and, most importantly, frees up your team to spend their time on smart analysis instead of mind-numbing report building.
Strategic Reporting Cadence by Audience
To ensure your insights land with the right people at the right time, you need a reporting rhythm. A well-defined cadence prevents data overload for some and information vacuums for others, making sure your hard-earned data actually gets used to make better decisions.
Report Frequency | Primary Audience | Key Metrics to Include |
|---|---|---|
Weekly | Content Team & Practitioners | Leading Indicators: Organic Traffic, Top Pages, Time on Page, Keyword Rankings, CTA Clicks, New Leads. |
Monthly | Marketing Leadership | Performance vs. Goals: MQLs from Content, Lead-to-Customer Rate, Channel Performance, Pipeline Generated. |
Quarterly | Executive Team & C-Suite | Business Impact & ROI: Content-Sourced Revenue, Customer Acquisition Cost (CAC) by Content, Overall ROI. |
This structured approach ensures that everyone from the writers on the ground to the leaders in the boardroom has a clear, consistent view of how content is contributing to the bigger picture. It turns reporting from a chore into a strategic asset.
Turning Performance Insights Into Better Content
So, your dashboards are live and reports are starting to hit your inbox. Now what? The whole point of measuring content performance isn't just to make pretty charts; it's to kick off a cycle of continuous, data-backed improvement. This is where you close the loop—transforming raw numbers into smarter, more effective content that people actually want to read.
Think of the data you've gathered as a roadmap. It’s telling you exactly what your audience loves, what they scroll right past, and where the hidden opportunities are. By tuning into these signals, you can stop guessing what might work and start knowing what will.
It’s all about making your data actionable, moving from passive observation to an active strategy for growth.
Identify Your Top-Performing Content Clusters
First things first: find your winners. Dive into your analytics and pinpoint the "clusters" of content driving the best results. A cluster isn't just one blog post; it could be a whole topic, a specific format (like listicles or case studies), or articles built for a certain stage of the buyer's journey.
Don't just fixate on traffic, either. Look for the content that brings in the most:
High-quality leads: Which articles are consistently filling your pipeline with MQLs?
Audience engagement: Which pieces have the highest time on page and the lowest bounce rates?
Organic visibility: Which topics are locking down top spots for your most important keywords?
Once you've found these MVPs, the strategy is simple: replicate their success. Double down on what's working by creating more content around those proven topics and formats. These insights are also gold for your content repurposing efforts. For more on that, check out our deep dive on content repurposing strategies.
Diagnose and Treat Underperforming Assets
Just as important as celebrating your wins is dealing with your underperformers. Every piece of content that's just sitting there, not pulling its weight, is a missed opportunity. For each of these low-performing assets, you really have three options: update, rewrite, or retire.
Update: This is your go-to for content that's still relevant but a bit stale. Think refreshing statistics, swapping in new examples, or giving the on-page SEO a quick tune-up.
Rewrite: Sometimes the core topic is solid, but the execution just missed the mark. Maybe the angle was wrong, or the writing simply didn't connect. A full rewrite can give it a new lease on life.
Retire: For content that's completely irrelevant, targeting the wrong audience, or just too thin to save. It happens. The best move is often to delete it and redirect the URL to a better resource.
This shouldn't be a random process. By regularly auditing your library, you ensure your entire content ecosystem is working hard for your business.
The best content teams I've seen operate like gardeners. They constantly feed their high-growth plants, prune the ones that aren't thriving, and clear out the dead wood to make room for new growth.
Continuously Optimize with A/B Testing
Even your best-performing content has room for improvement. You'd be surprised how much of a lift you can get from simple A/B tests on things like headlines and calls-to-action (CTAs). And you don't need a complicated, expensive setup to get started.
Most email marketing platforms and many modern CMSs have A/B testing features baked right in. Try testing a benefit-driven headline against a question-based one. Or pit a direct CTA ("Download Now") against a softer one ("Learn More"). These small, iterative tweaks can lead to some seriously big wins over time. This focus on optimization is increasingly tied to the bottom line, with over 40% of marketers now using sales or revenue as a primary metric for content success.
Turn Competitor Success into Your Next Big Idea
Finally, remember that your own data isn't your only source of truth. Your competitors' most popular content is a goldmine of ideas just waiting to be excavated. This is where a tool like Notize AI becomes a secret weapon.
Instead of spending hours manually slogging through a competitor's webinar or popular YouTube video, you can just feed the link into Notize AI. In moments, it hands you a structured summary, highlighting the key points, outlining the structure, and boiling down the core message.
This gives you an instant blueprint of what made their content successful. You can quickly see why it resonated, spot gaps in their argument, and brainstorm fresh angles for your own content. Notize AI turns competitive analysis from a tedious chore into a fast, actionable source of inspiration, helping you get from insight to creation in a fraction of the time.
Common Questions About Measuring Content
Even with the slickest dashboards, you're going to have questions. Getting content measurement right means wrestling with the same nuances and challenges every marketing team runs into. Let's tackle some of the most common questions we hear to help you sharpen your own measurement strategy.
How Often Should I Measure My Content Performance?
There's no single right answer here—the perfect cadence depends entirely on what you're measuring and why. It's best to think in tiers.
Your leading indicators need a weekly pulse check. This is where you’ll look at things like organic traffic, engagement metrics, and keyword rankings. A quick weekly review lets you catch trends or anomalies early and make small adjustments before they turn into major problems.
Then you have your lagging indicators, which are better suited for a monthly or quarterly review. These are the bigger-picture metrics that take time to develop, like lead generation, MQLs, and content-influenced revenue. A monthly check-in is great for tracking progress against KPIs, while a deep quarterly analysis is what you'll need to inform your long-term strategy and fight for budget.
What Are the Most Common Mistakes to Avoid?
I see teams stumble over the same hurdles again and again when they start getting serious about measurement. Steer clear of these, and you'll be way ahead of the curve.
The absolute biggest mistake is fixating on vanity metrics. Sure, page views and social likes look good in a report, but they're hollow without a direct line to business goals. For every metric you track, you have to be able to answer the question, "So what?"
Another classic error is inconsistent tracking. Forgetting to use UTM parameters on campaigns, for example, blows a hole in your attribution data. You'll have no real idea where your wins are coming from. Also, resist the urge to become a "data hoarder"—collecting every metric under the sun without a clear plan for what you’ll do with the information.
Finally, stop measuring every piece of content with the same yardstick. A top-of-funnel blog post built for brand awareness has a totally different job than a bottom-of-funnel case study designed to close a deal. They need different goals and, by extension, different KPIs.
How Do I Prove the ROI of Brand Awareness Content?
This is a tough one, because the impact of top-of-funnel content is often indirect. The trick is to look at a collection of signals that, when viewed together, paint a compelling picture of value.
Start by tracking metrics that point to growing brand strength. Are more people searching for your company name? That’s an increase in branded search volume. Is your direct traffic climbing? Are you capturing a greater share of voice on social media than your competitors? These are all powerful signs that your awareness efforts are paying off.
You should also become best friends with the "assisted conversions" report in Google Analytics. It will show you exactly how many times your brand content showed up in a customer's journey before they converted, proving its role in nurturing that relationship. If you're running webinars, our guide on recording a webinar has some great tips for post-event analysis.
The true value of brand awareness content isn't just in immediate clicks; it's in becoming the first name your audience thinks of when they have a problem you can solve. That long-term trust is where the real ROI lies.
How Does Notize AI Help with Content Measurement?
Notize AI was designed to make your entire measurement workflow simpler and richer. It helps bridge the gap between the "what" (your quantitative data) and the "why" (your qualitative insights).
It acts as your team's memory. By recording the strategic meetings where you set your goals and KPIs, Notize AI creates a single, searchable source of truth. Everyone stays aligned on what success actually looks like.
It helps you find the "why" behind the numbers. You can upload customer interviews, sales calls, or even analyze a YouTube video from a competitor. Notize AI will automatically pull out key themes, pain points, and direct quotes. This gives you invaluable context that you can't get from a spreadsheet.
It makes reporting faster. Instead of building a slide deck from scratch, just record a quick video walking through your performance dashboard. Notize AI will generate a structured summary with key takeaways and action items, making it ridiculously easy to share insights with stakeholders and get everyone on the same page.
It turns insights into action. A journalist or creator can use Notize AI to automatically generate a high-quality blog post from a recorded interview, complete with analytics to track performance and AI suggestions to improve engagement.
It essentially turns measurement from a backward-looking chore into a forward-looking catalyst for action.
Ready to stop guessing and start knowing? Notize AI turns your meetings, videos, and audio files into actionable insights, clear summaries, and publish-ready content. See how teams are saving time and making smarter, data-driven decisions.
How to Measure Content Performance and Prove Its Value