Let's cut through the jargon. At its core, a social media analytics dashboard is your mission control for all things social. It pulls in data from every platform you're on—Facebook, Instagram, LinkedIn, you name it—and displays it in one central, visual hub. No more jumping between tabs or drowning in spreadsheets.
This tool transforms a chaotic flood of raw numbers into clear, easy-to-read charts and graphs. Think of it as a real-time command center that lets you monitor your social media strategy at a glance, so you can stop manually compiling reports and start making smarter decisions.
Your Social Media Command Center
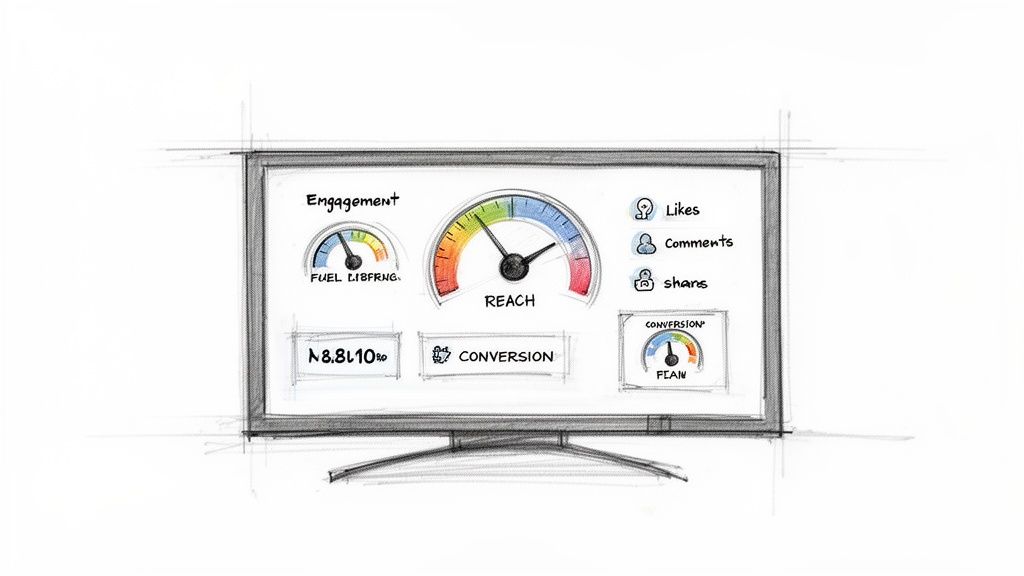
Imagine trying to fly a plane with the altitude, speed, and fuel gauges scattered all over the cockpit. You'd be spending all your time just trying to get a clear picture, not actually flying. A social media analytics dashboard is the instrument panel that brings everything together for your marketing efforts.
Instead of logging into five different platforms to see five slivers of the story, a dashboard consolidates it all. You get a unified view of the metrics that truly matter—engagement, reach, conversions—allowing you to see the big picture and react quickly. A good dashboard helps you move past vanity metrics (like raw follower counts) and uncovers the real story behind your performance, turning confusing data into clear, actionable steps.
To break it down even further, here's a look at the essential components that make a dashboard work.
Core Dashboard Components at a Glance
Component | Purpose | Example Metric |
|---|---|---|
Data Aggregation | Pulls raw data from multiple social media platforms into a single location. | Total Followers (Combined) |
Key Metrics (KPIs) | Displays the most critical performance indicators for quick assessment. | Engagement Rate |
Visualizations | Transforms numbers into charts, graphs, and gauges for easy interpretation. | Reach Over Time (Line Chart) |
Filters & Segments | Allows you to drill down into specific date ranges, campaigns, or platforms. | Clicks from Instagram Stories |
Reporting Tools | Enables automated or manual generation of performance reports for stakeholders. | Monthly Performance PDF |
These elements work together to give you a complete, interactive view of your social media health and impact.
Connecting Social Data to Business Insights
This command center gets really powerful when it starts talking to other parts of your business. For instance, using a tool like Notize AI lets you connect the dots between a strategy meeting and a campaign that takes off. Notize AI can automatically produce a full, structured meeting summary, complete with key discussion points, action items, and a searchable timeline.
This creates a direct line of sight between what was planned in a meeting and what's actually working on social media—no manual data entry required. If a content pillar from a strategy session you recorded in Notize AI leads to a viral video, you can trace that success right back to its source.
A great dashboard doesn't just show you what happened; it helps you understand why it happened. It bridges the gap between your strategy, your content, and your results.
The Growing Need for Centralized Analytics
The demand for these unified dashboards isn't just a trend; it's a fundamental shift in how businesses operate. With a staggering 4.9 billion users on social platforms in 2023, the sheer scale of data is impossible to manage otherwise.
The numbers back this up. The global social media analytics market was valued at USD 8.84 billion in 2024 and is expected to explode to USD 46.49 billion by 2032. This massive growth highlights a simple truth: for today's marketing, content, and operations teams, dashboards are no longer a nice-to-have. They're an essential tool for making daily decisions. You can dive deeper into the social media analytics market size and forecast to see just how critical this space has become.
Decoding the Metrics That Actually Matter
Opening up a social media analytics dashboard for the first time can feel like you're staring at the cockpit of a 747. It's a sea of numbers, graphs, and acronyms. But here’s the secret: a dashboard overflowing with data is useless unless you know which numbers tell the real story. The whole point is to cut through the noise and zero in on the metrics that actually align with what you're trying to achieve.
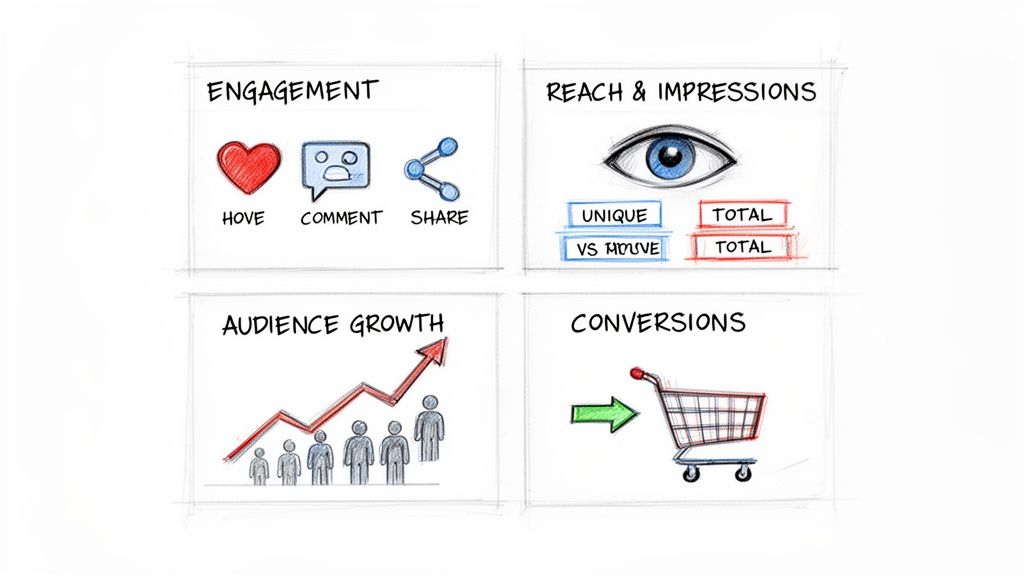
These key metrics usually fall into four buckets, each one telling a different part of your performance story.
Think about it this way: you post a great video to YouTube. Getting a lot of views is nice, but the real win is understanding why it took off. That's where tools like Notize AI come in. You can send a link from YouTube, and Notize AI will analyze the content, find the exact hooks that grabbed people, and instantly generate fresh content ideas engineered to drive specific metrics, like more shares or saves. It’s about closing the loop between looking at data and creating better content.
Engagement and Interaction Metrics
Engagement is the heartbeat of your social media presence. It’s not just a vanity metric; it’s a direct measure of how much your audience is leaning in and interacting with what you’re putting out there. When engagement is high, you know you’re building a genuine community, not just shouting into the void.
Here are the core engagement numbers to watch:
Likes and Reactions: Your first and fastest signal that a piece of content caught someone's eye.
Comments: This is where the real conversation happens. It's direct feedback, a chance for dialogue, and a goldmine of audience insight.
Shares: When someone shares your content, they're vouching for it with their own network. It's one of the most powerful forms of organic marketing you can get.
Saves: This one is a sleeper hit. A save means your content was so useful or inspiring that someone bookmarked it to come back to later. That's a huge win.
Reach and Audience Growth Metrics
If engagement tells you how deep your connection is, reach and growth metrics tell you how wide your net is being cast. These numbers show you how many eyeballs are on your content and whether you’re bringing new people into your orbit over time. This is how you gauge brand visibility and see if your distribution efforts are paying off.
The important metrics to track here are:
Reach vs. Impressions: This is a classic point of confusion. Reach is the number of unique people who saw your post. Impressions are the total times it was seen (one person could see it three times, for example). If your impressions are way higher than your reach, it means you're hitting the same people over and over again.
Follower Growth Rate: Forget just looking at the total follower count. The growth rate (as a percentage) tells you how fast you're expanding your audience, which is a much more dynamic and telling figure.
Audience Demographics: Knowing the age, location, and interests of your followers is crucial. It's the difference between creating content you think they'll like and content you know they'll like.
Getting a handle on these numbers is the first step. For a deeper dive, check out our guide on how to measure content performance and start turning that data into a real strategy.
Conversion and Business Impact Metrics
At the end of the day, social media has to contribute to the business. Conversion metrics are the bridge between your social media activity and actual business results. These are the numbers that prove the ROI of your efforts and show how your dashboard data translates into dollars and cents.
To measure your real-world impact, track these:
Click-Through Rate (CTR): The percentage of people who saw your post and were compelled enough to actually click the link.
Cost Per Click (CPC): If you're running paid ads, this tells you exactly what you're paying for every single click.
Conversion Rate: This is the big one. It's the percentage of people who clicked your link and then took the action you wanted them to, like signing up for your newsletter or making a purchase.
What Makes a Great Dashboard? The Essential Features
A basic social media dashboard shows you numbers. A truly powerful one tells you a story. The real difference is in the features—the tools that turn a sea of raw data into a clear narrative about what’s working and what isn’t. This is what lets you stop guessing and start making strategic moves with confidence.
Let's be clear: not all dashboards are built the same. The best ones are dynamic, intuitive, and designed to answer your biggest questions in seconds. Think of it less like a static, printed report and more like an interactive command center for your entire social media strategy.
Data Visualization and Customization
At its heart, a great dashboard makes complex data easy to understand at a glance. It moves you past the limitations of spreadsheets and into a world of visual storytelling with charts and graphs you can arrange to fit your team's unique goals.
Look for these key visualization features:
Customizable Widgets: You need the power to drag and drop different charts, graphs, and data points. This lets you build a dashboard that puts your most important metrics front and center.
Real-Time Data Updates: The social world moves fast. Your dashboard needs to keep up, reflecting performance as it happens, not days later. This is what allows you to jump on a viral trend or pull an ad that's tanking.
Historical Data Comparison: Context is everything. The ability to compare this week's performance against last week, last month, or even last year is what helps you know if that engagement spike is a genuine win or just a return to your normal baseline.
Automated Reporting and Content Integration
Beyond just looking at data, a powerful dashboard should actively save you time. Automated reporting is a non-negotiable feature. It allows you to schedule and send performance summaries to stakeholders without lifting a finger, keeping everyone in the loop consistently.
But this is where the idea of a dashboard really starts to evolve. A tool like Notize AI becomes a central hub that links your content’s creation directly to its performance. Imagine a journalist records an interview, uses Notize AI to instantly generate a high-quality blog post from it, and publishes it right from the app with built-in analytics.
The real magic happens when a platform closes the loop between creation and analysis. It stops being about just viewing data and becomes about seeing the immediate impact of the content you just shipped.
The moment that post goes live, you can see how it’s performing and track audience interaction almost instantly. This kind of integration connects an idea from a team meeting, to the content created in Notize AI, and straight through to the performance data on your dashboard. It’s a complete, connected workflow.
The demand for these all-in-one tools is skyrocketing. Decision-makers want user-friendly dashboards that tell a clear story, which is why the visualization part of the social media analytics market is projected to explode from $1.58 billion in 2024 to $7.41 billion by 2030. This trend highlights a major shift: businesses need tools that do more than just report the numbers. You can dig deeper into this market trend in Grand View Research's market analysis.
How Different Teams Use a Centralized Dashboard
A social media analytics dashboard is much more than a playground for marketers. Think of it as a town square for your entire company—a central place where different teams can gather to get a real, unfiltered look at the customer, the market, and the product. When everyone is looking at the same source of truth, the walls between departments start to crumble, paving the way for smarter, more coordinated decisions.
Each team might come to the dashboard with a different question, but the shared data provides the answers they all need to move forward together.
Marketing and Content Teams
For marketers and content creators, the dashboard is mission control. It's where strategy meets reality, offering instant feedback on what’s hitting the mark with your audience and what's falling flat. This allows for quick, data-backed adjustments instead of just guessing what to do next.
Campaign Optimization: Marketers live and breathe metrics like Return on Ad Spend (ROAS) and Cost Per Click (CPC). If a campaign is underperforming, the dashboard flags it immediately, so they can shift budgets to the ads that are actually working.
Content Strategy: Content teams can pinpoint exactly which topics, formats, and tones get people talking. A sudden surge in shares on a behind-the-scenes video is a clear signal to make more of that content.
This feedback loop is incredibly powerful. For example, a creator can use Notize AI to repurpose a viral TikTok video into a step-by-step guide for their blog. After publishing through Notize AI, they can hop right back into the dashboard to see how that new content performs, creating a continuous cycle of improvement.
Product and Development Teams
Product teams are always hunting for insights into what users truly want and where they're getting stuck. While direct feedback is invaluable, social media provides a massive, unsolicited stream of customer opinions and real-world frustrations.
The dashboard is both an early warning system and an idea factory. It captures the raw voice of the customer, often revealing pain points and feature ideas that would never make it into a formal feedback survey.
Imagine the product team using Notize AI to transcribe a series of recorded customer feedback sessions, automatically pulling out key themes and pain points. They can then jump over to their social media dashboard and see if those same themes are popping up in public conversations. This lets them validate which problems are most pressing and prioritize their development roadmap with genuine confidence.
Operations and Customer Success
For operations and customer success, the dashboard is a real-time health monitor for the brand. They keep a close eye on sentiment trends to gauge customer happiness and spot potential crises before they blow up. It’s all about being proactive, not reactive.
These teams use the dashboard to:
Identify Service Gaps: A sudden spike in negative mentions about shipping times? That's an immediate alert for the ops team to investigate a potential logistics breakdown.
Improve Support Resources: By tracking the questions people ask most often on social media, the success team can build out better help guides and FAQs to address those exact issues.
The following table breaks down exactly how these teams can put a dashboard to work.
Dashboard Use Cases by Team Function
Team | Primary Goal | Key Dashboard Metrics | How Notize AI Helps |
|---|---|---|---|
Marketing & Content | Drive engagement and optimize campaign ROI. | Engagement Rate, Reach, ROAS, CPC, Share of Voice | Generates blog posts from video content and analyzes audience interaction in-app. |
Product & Development | Understand user needs and prioritize features. | Sentiment Analysis, Mention Volume, Keyword Trends | Transcribes user interviews and cross-references themes with social media sentiment. |
Operations & Success | Monitor brand health and improve customer support. | Response Time, Customer Satisfaction (CSAT), Sentiment Trends | Identifies recurring customer issues from social conversations to inform proactive support. |
Ultimately, a shared social media analytics dashboard gets everyone on the same page, speaking the same language. This unity fuels more than just efficiency; it’s fundamental to creating a truly collaborative workplace. For more on this, check out our guide on how to improve team collaboration. When the entire organization is guided by the same data, it moves smarter, faster, and with a shared purpose.
Setting Up Your First Analytics Dashboard
Building your first social media analytics dashboard sounds a lot more intimidating than it actually is. The secret isn't knowing every metric under the sun; it's starting with a clear purpose. Think of it like building a custom control panel for a spaceship—you only want the buttons and dials that get you to your destination, not every single one that exists.
The most important first step is pinning down your business objectives. What are you really trying to accomplish here? Are you focused on growing brand awareness, driving more traffic to your blog, or pulling in qualified leads? Nail this down first. It ensures every metric you add to your dashboard serves a real purpose and connects back to something that actually moves the needle for your business.
From Goals to Visuals: A Practical Walkthrough
Once you know what you're aiming for, the rest of the process starts to click into place. You’ll know which social platforms to pull data from, how to connect your accounts, and—most importantly—which charts and graphs will tell your story at a glance.
Here’s a simple way to think about the process:
Define Clear Business Objectives: Forget the vanity metrics for a moment. Start with a concrete goal like, "We need to increase lead generation from LinkedIn by 15% this quarter," or "Let's boost engagement on our Instagram video content." This clarity is your North Star.
Select Your Platforms and Data Sources: Now, connect the accounts that directly relate to that goal. That might be your Facebook Ads Manager, your company's LinkedIn Pages, or even your YouTube channel analytics.
Choose Relevant Visualizations: Pick the right tool for the job. A line chart is your best friend for tracking trends over time, like follower growth. A bar chart, on the other hand, is perfect for comparing things side-by-side, like the performance of different ad campaigns.
This workflow isn't just for one person; it becomes the central hub where different teams—from marketing to product—get the insights they need to make smarter decisions.
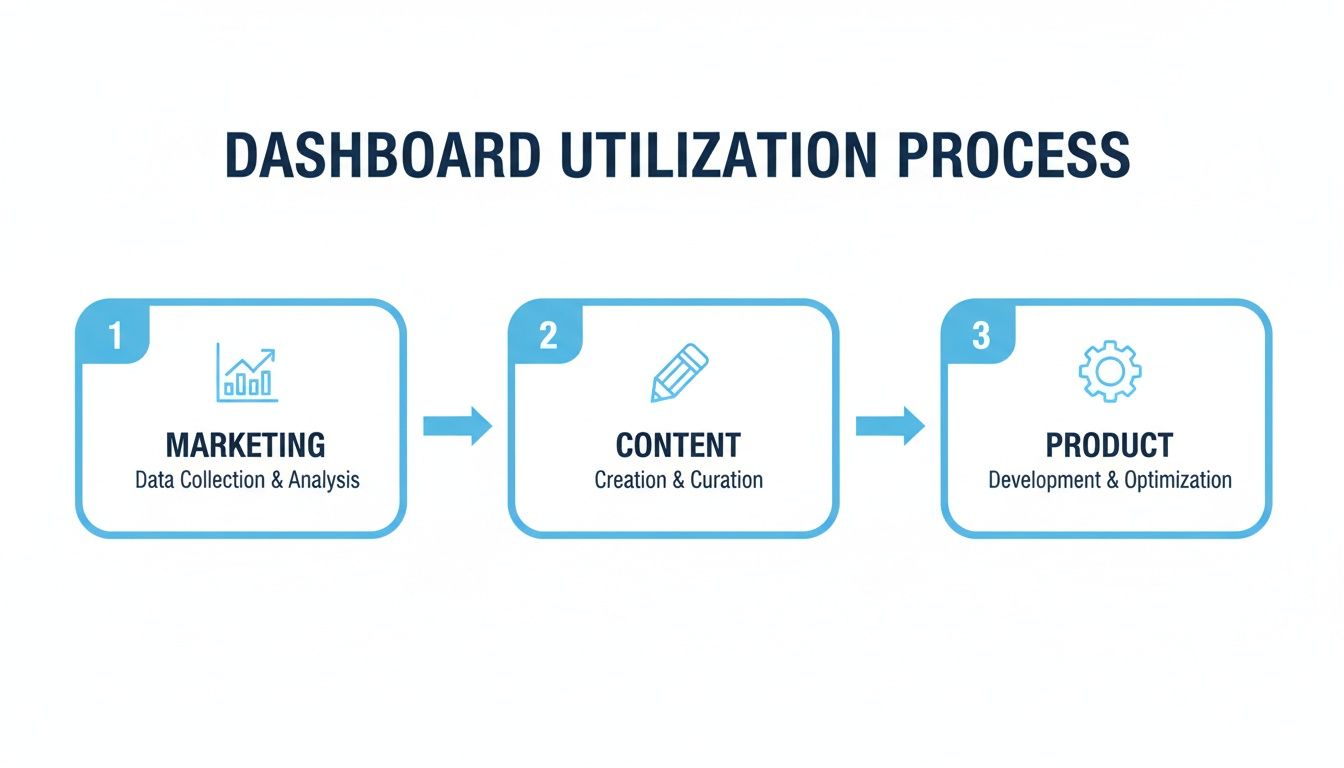
As you can see, it’s a unified process. Marketing spots a trend, the content team creates a response, and the product team gets feedback—all from one shared source of truth.
Automating the Setup with Modern Tools
Thankfully, modern tools have completely streamlined this setup, so you don't have to be a data scientist to get started. With a platform like Notize AI, a lot of the heavy lifting is handled for you. For example, a student can just upload a lecture video, and Notize AI doesn't just transcribe and summarize it; it also generates study guides and allows them to ask AI questions about the content.
The real game-changer with modern tools is how they connect the act of content creation directly to performance analysis. What used to take hours of manual setup now takes just a few minutes.
Instead of wrestling with APIs and spreadsheets to connect data sources, Notize AI provides a single dashboard where you can analyze media, generate content, and track its impact. For creators, this is incredibly powerful. You could analyze a competitor's YouTube video for ideas, use Notize AI to create a more compelling blog post on the topic, publish it, and instantly see how it’s performing—all without a complex or technical setup. This approach makes building your first dashboard less about configuration and more about getting straight to the insights.
Turning Your Dashboard Insights Into Action
A social media analytics dashboard is fantastic at showing you what happened. You can see the spikes, the dips, and all the latest trends at a glance. But its real power shines when it forces you to ask the most critical question: why did it happen? This is the moment raw data becomes a real strategy.
Think of it this way: your dashboard should spark curiosity. When you spot something unusual—like a random post suddenly getting a massive number of shares—it should make you want to dig in and understand the story behind the numbers. This is what separates people who just look at data from those who use it to make smart decisions.
The Observe, Analyze, Act Framework
To make this practical, you can follow a simple, repeatable framework. It’s a three-step loop that helps you turn any metric on your dashboard into a clear action.
Observe the Data: Start by spotting something significant on your dashboard. Maybe you notice a short video summary you posted got 300% more engagement than your usual content. That's your "what."
Analyze the Cause: Now, it's time to figure out the "why." Instead of just guessing what made it popular, you can get a concrete answer. For instance, you could upload the original long-form video into Notize AI. The platform can instantly transcribe and analyze it, letting you ask the AI questions to pinpoint the exact hook or powerful quote that captured everyone's attention.
Act on the Insight: With this knowledge, you can act immediately. Use Notize AI to generate a full blog post that dives deeper into that specific high-performing idea. Just like that, you’ve turned a momentary social media win into a long-lasting piece of content, getting far more value out of your initial effort. For more ideas, check out our guide to powerful content repurposing strategies.
This framework closes the gap between seeing data and actually creating something with it. Your dashboard becomes more than a report card; it’s the starting point for a smarter content workflow.
The great news is that tools like this are no longer just for massive companies with huge budgets. The North American social media analytics market is expected to reach USD 5.1 billion by 2028, and much of that growth is coming from smaller and mid-sized businesses. This shift means powerful, dashboard-driven analytics are more accessible than ever. You can learn more about this expanding market and its global trends to see where things are headed.
A Few Common Questions About Analytics Dashboards
Even the most seasoned pros have questions when digging into analytics. Let's tackle some of the most common ones that come up when working with a social media analytics dashboard.
How Often Should I Be Checking My Dashboard?
This is a classic "it depends" scenario, but I can give you some solid guidelines. If you're in the middle of a big product launch or running a time-sensitive campaign, you'll want to be in there daily. This lets you spot what's working (or what's not) and make quick adjustments on the fly.
For your regular, "business as usual" content strategy, a deep dive once a week is usually perfect. This gives you enough data to see real trends and measure how you're tracking against your KPIs without getting bogged down. The key isn't frequency, it's consistency. A platform like Notize AI is great for this because it helps you create content from insights and has analytics built right in, helping you keep a pulse on performance without obsessive, round-the-clock monitoring.
What's the Biggest Mistake People Make With Dashboards?
Hands down, the biggest trap is what I call "data-gazing"—staring at charts and numbers without doing anything about them. A dashboard isn't just a trophy case for your metrics; it's a tool meant to spark questions and guide your next move.
The goal is to avoid getting mesmerized by vanity metrics. Instead, laser-focus on the data that actually connects to your business goals, like engagement rates on posts about a new feature or conversions driven by a specific campaign. Always be asking yourself, "Okay, so what are we going to do differently because of this?"
Can I Set Up a Dashboard Without Shelling Out for Expensive Tools?
You absolutely can. A great starting point is to use the free, native analytics tools that platforms like Facebook, Instagram, and LinkedIn already provide. They offer a ton of useful information. But the real magic of a dedicated social media analytics dashboard is seeing everything from all your platforms in one single, unified view.
This is where integrated platforms really pull their weight. A tool like Notize AI is so effective because it doesn't just show you the data; it connects it directly to your content creation workflow. You can, for instance, create a blog post from a video you analyzed and then immediately start tracking its performance, all in the same place. It's a smart, cost-effective way to get a complete picture without juggling a half-dozen expensive subscriptions.
Ready to connect your content creation directly to its performance? Notize AI offers a unified dashboard where you can capture, analyze, create, and measure your content's impact all in one place. Start turning your insights into action today by visiting https://notize.ai.
A Guide to the Social Media Analytics Dashboard